


How much do advertisers pay for YouTube ads today? In this article we look at YouTube CPM rates 2026 and compare them with our own numbers from 2020. CPM is the cost per thousand ad impressions. In short, prices have grown a lot in six years. However, the gap between countries and topics is still huge.
First, an honest note about the data. The 2020 numbers come from a real channel, CuteStockFootage.com. The 2026 numbers are different. They are published industry estimates and our own projections. Therefore, treat them as a guide and not as exact values.
YouTube CPM rates 2026 at a glance
Public sources do not agree on one number. For example, VloggingPro gives a typical range of $2 to $15 for most creators. Meanwhile, Mediacube lists $20 to $42 for the United States alone. So the answer depends on the country, the topic and the season.
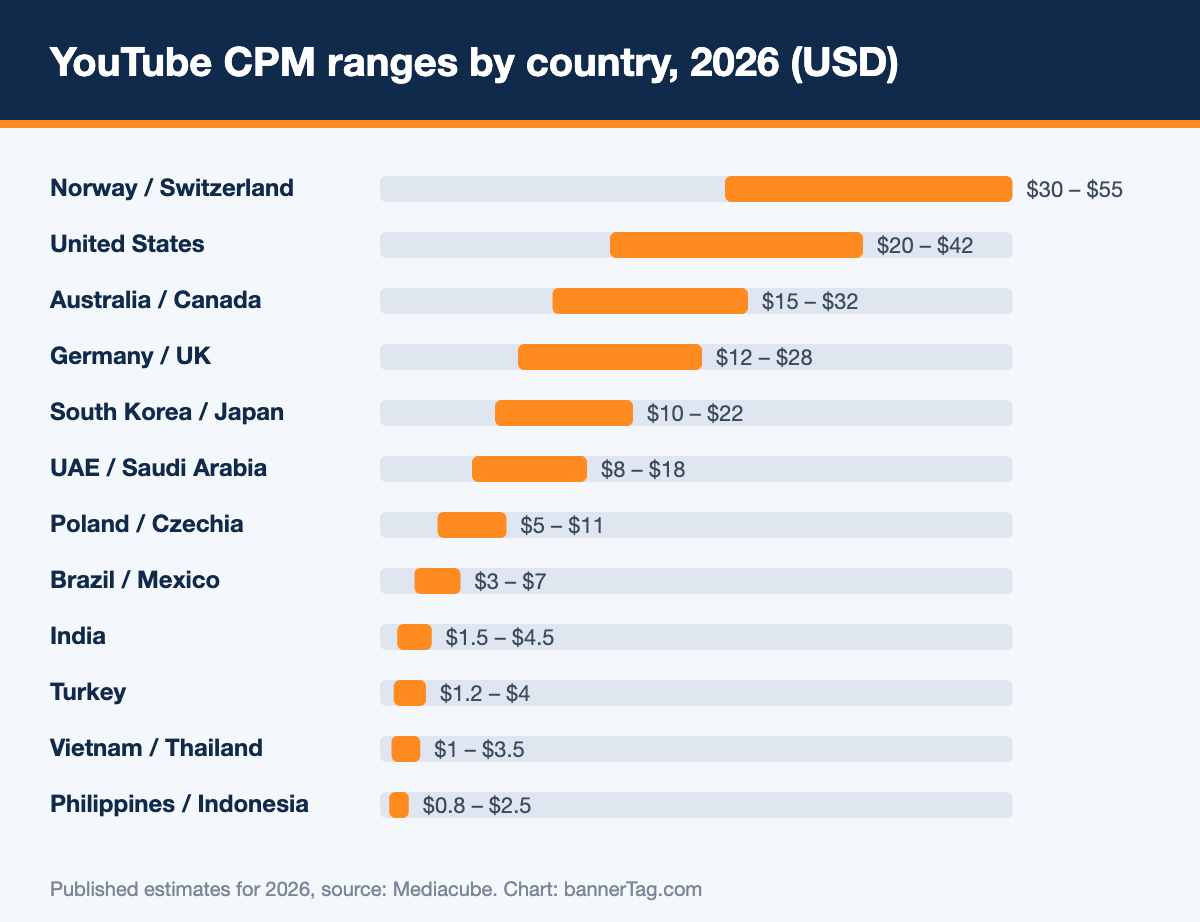
As a result, viewers in Norway, Switzerland and the United States are worth many times more than viewers in India or Indonesia. In addition, the two sources differ for the same country. VloggingPro puts the United States at $5 to $30 and more, and the United Kingdom at $4 to $20.
YouTube CPM rates 2026 by niche
The topic of a channel matters as much as the country. Advertisers pay the most where one customer brings a lot of money. For instance, finance channels earn far more per view than gaming channels. The table below combines the ranges from both sources.
| Niche | CPM range 2026 (USD) |
|---|---|
| Finance and investing | $12 – $50 |
| Business, SaaS and B2B | $10 – $30 |
| Technology and software | $4 – $25 |
| Education | $5 – $12 |
| Health and fitness | $4 – $12 |
| Lifestyle and vlogs | $1.50 – $7 |
| Gaming | $1 – $5 |
| Entertainment and music | $0.50 – $3 |
Why are YouTube CPM rates higher than in 2020?
- More advertisers. Video budgets keep moving from TV to online platforms. Consequently, more brands compete in the auction.
- Auction pricing. YouTube ads sell in an auction, just like header bidding on websites. Therefore more demand means higher prices.
- Inflation. Prices for almost everything went up after 2020, and ads are no exception.
- More ad formats. In addition, long videos now carry more mid-roll ads.
Seasons still matter as well. Prices are highest from October to December. After that, they usually fall in January and February.
How much does YouTube keep?
CPM is what advertisers pay. However, creators do not receive all of it. YouTube keeps 45% of the ad revenue from long videos, and the creator gets 55%. For Shorts the split is the opposite, so the creator keeps 45%. Because of this, the number that matters for income is RPM, the revenue per thousand views.
Do you run a website as well? Then compare these numbers with Google AdSense CPM rates.
Estimated YouTube CPM rates 2026 per country
Our 2020 article listed real CPM values per country from one channel. We do not have the same channel report for 2026. Instead, we projected the old values forward. We multiplied every 2020 CPM by 2.5. This factor is an assumption. It reflects the rough growth of two to three times that public benchmarks suggest for this period.
Keep three things in mind. First, the estimate applies the same growth to every country, which is a simplification. Second, the source channel shows stock footage, so its CPM is far below the published averages above. Third, small countries had few views in 2020, so we list only countries with at least 10,000 views.
Countries 1 to 30 by views
| Country | 2020 CPM, measured (USD) | 2026 CPM, estimate (USD) | Views in 2020 sample |
|---|---|---|---|
| India | 0.70 | 1.75 | 13,960,985 |
| Indonesia | 0.20 | 0.50 | 3,923,993 |
| Thailand | 0.27 | 0.68 | 1,184,465 |
| Brazil | 0.32 | 0.80 | 663,149 |
| United States | 0.38 | 0.95 | 648,763 |
| Turkey | 3.08 | 7.70 | 580,988 |
| Vietnam | 0.25 | 0.63 | 560,255 |
| Saudi Arabia | 0.33 | 0.83 | 453,852 |
| Philippines | 0.48 | 1.20 | 297,437 |
| Italy | 0.89 | 2.23 | 243,070 |
| Russia | 1.45 | 3.63 | 196,225 |
| Malaysia | 1.40 | 3.50 | 190,061 |
| Mexico | 0.56 | 1.40 | 185,506 |
| Bangladesh | 0.70 | 1.75 | 182,076 |
| Iraq | 0.71 | 1.77 | 162,529 |
| Egypt | 0.29 | 0.72 | 158,821 |
| Morocco | 0.34 | 0.85 | 156,090 |
| Pakistan | 0.59 | 1.47 | 154,697 |
| South Korea | 0.30 | 0.75 | 143,035 |
| Japan | 2.46 | 6.15 | 141,638 |
| France | 4.51 | 11.27 | 120,859 |
| Nepal | 2.14 | 5.35 | 115,739 |
| Germany | 0.36 | 0.90 | 112,025 |
| United Kingdom | 2.67 | 6.67 | 109,306 |
| Spain | 4.38 | 10.95 | 107,667 |
| Algeria | 2.57 | 6.42 | 99,012 |
| Argentina | 0.77 | 1.93 | 94,415 |
| Cambodia | 0.52 | 1.30 | 92,678 |
| United Arab Emirates | 1.37 | 3.43 | 89,219 |
| Colombia | 0.87 | 2.17 | 76,564 |
Countries 31 to 60 by views
| Country | 2020 CPM, measured (USD) | 2026 CPM, estimate (USD) | Views in 2020 sample |
|---|---|---|---|
| Taiwan | 0.59 | 1.47 | 75,677 |
| Canada | 2.63 | 6.57 | 68,940 |
| Sri Lanka | 4.06 | 10.15 | 67,699 |
| Azerbaijan | 0.59 | 1.47 | 67,110 |
| Ukraine | 1.27 | 3.17 | 60,650 |
| Peru | 1.24 | 3.10 | 54,793 |
| Kuwait | 1.12 | 2.80 | 53,989 |
| Chile | 0.54 | 1.35 | 46,945 |
| Senegal | 0.80 | 2.00 | 46,703 |
| Poland | 0.76 | 1.90 | 45,232 |
| Romania | 1.85 | 4.63 | 44,891 |
| Myanmar | 1.22 | 3.05 | 44,718 |
| Kazakhstan | 1.77 | 4.42 | 43,335 |
| Australia | 1.66 | 4.15 | 43,315 |
| Greece | 6.23 | 15.58 | 42,643 |
| Lebanon | 1.70 | 4.25 | 42,235 |
| Israel | 0.58 | 1.45 | 41,544 |
| Hong Kong | 1.94 | 4.85 | 41,100 |
| Singapore | 2.90 | 7.25 | 41,038 |
| Netherlands | 2.00 | 5.00 | 35,383 |
| Oman | 3.78 | 9.45 | 32,841 |
| Uzbekistan | 0.94 | 2.35 | 32,025 |
| Ecuador | 1.53 | 3.83 | 31,806 |
| Tunisia | 1.00 | 2.50 | 30,874 |
| Albania | 0.74 | 1.85 | 28,526 |
| Portugal | 1.66 | 4.15 | 28,501 |
| Kenya | 3.02 | 7.55 | 26,977 |
| Somalia | 1.24 | 3.10 | 26,256 |
| Jordan | 1.50 | 3.75 | 25,973 |
| Bolivia | 0.73 | 1.82 | 24,412 |
Other countries
| Country | 2020 CPM, measured (USD) | 2026 CPM, estimate (USD) | Views in 2020 sample |
|---|---|---|---|
| Sweden | 0.84 | 2.10 | 23,086 |
| Armenia | 3.91 | 9.78 | 22,216 |
| Qatar | 1.11 | 2.78 | 19,936 |
| Syria | 1.32 | 3.30 | 19,664 |
| Dominican Republic | 2.67 | 6.67 | 18,788 |
| South Africa | 2.37 | 5.93 | 18,440 |
| Belgium | 3.43 | 8.58 | 18,358 |
| Lao People’s Democratic Republic | 5.09 | 12.72 | 18,207 |
| Yemen | 1.11 | 2.78 | 17,892 |
| Hungary | 0.90 | 2.25 | 17,811 |
| Georgia | 3.46 | 8.65 | 17,394 |
| Switzerland | 3.87 | 9.68 | 15,650 |
| Libya | 4.69 | 11.73 | 14,431 |
| Guatemala | 1.14 | 2.85 | 14,258 |
| Nigeria | 2.89 | 7.23 | 13,644 |
| Belarus | 3.31 | 8.28 | 12,960 |
| El Salvador | 3.03 | 7.57 | 12,653 |
| Costa Rica | 2.62 | 6.55 | 12,525 |
| Croatia | 1.85 | 4.63 | 12,495 |
| Palestine | 2.50 | 6.25 | 12,034 |
| Kyrgyzstan | 1.23 | 3.08 | 11,918 |
| Bulgaria | 1.10 | 2.75 | 11,855 |
| Côte d’Ivoire | 2.24 | 5.60 | 11,740 |
| Tanzania | 1.96 | 4.90 | 11,539 |
| Norway | 1.95 | 4.88 | 11,011 |
| Austria | 6.71 | 16.77 | 10,322 |
| Mauritius | 7.05 | 17.63 | 10,102 |
Do you want to see the original data? Then read YouTube Video CPM Rates 2020 and YouTube Video CPM Rates 2019.
Conclusion
To sum up, advertisers pay clearly more for YouTube ads than they did six years ago. Still, there is no single price. The country, the niche and the season decide what a view is worth. Therefore use the ranges in this article as a starting point. Then check the real numbers in your own YouTube Analytics.